Nocomed
Complex emissions data turned into design that's understood and shared.
Complex emissions data turned into design that's understood and shared
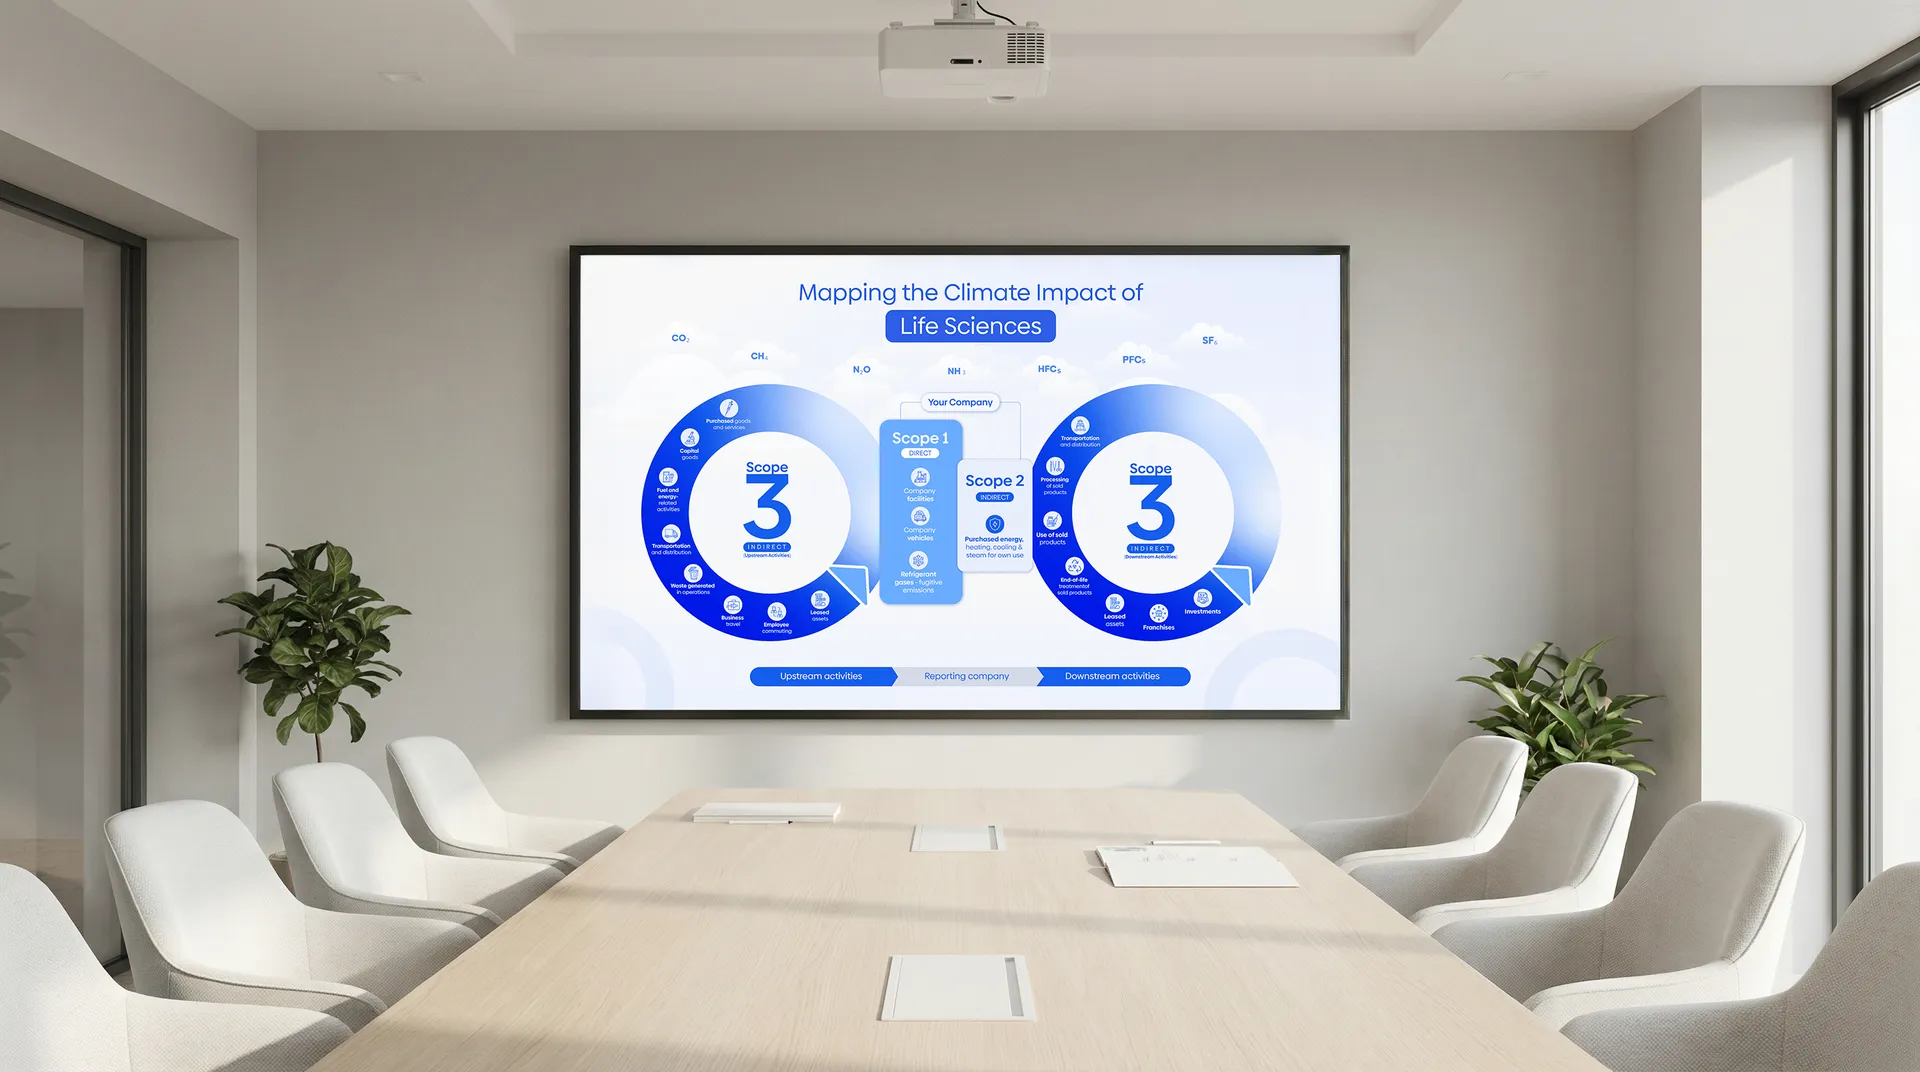
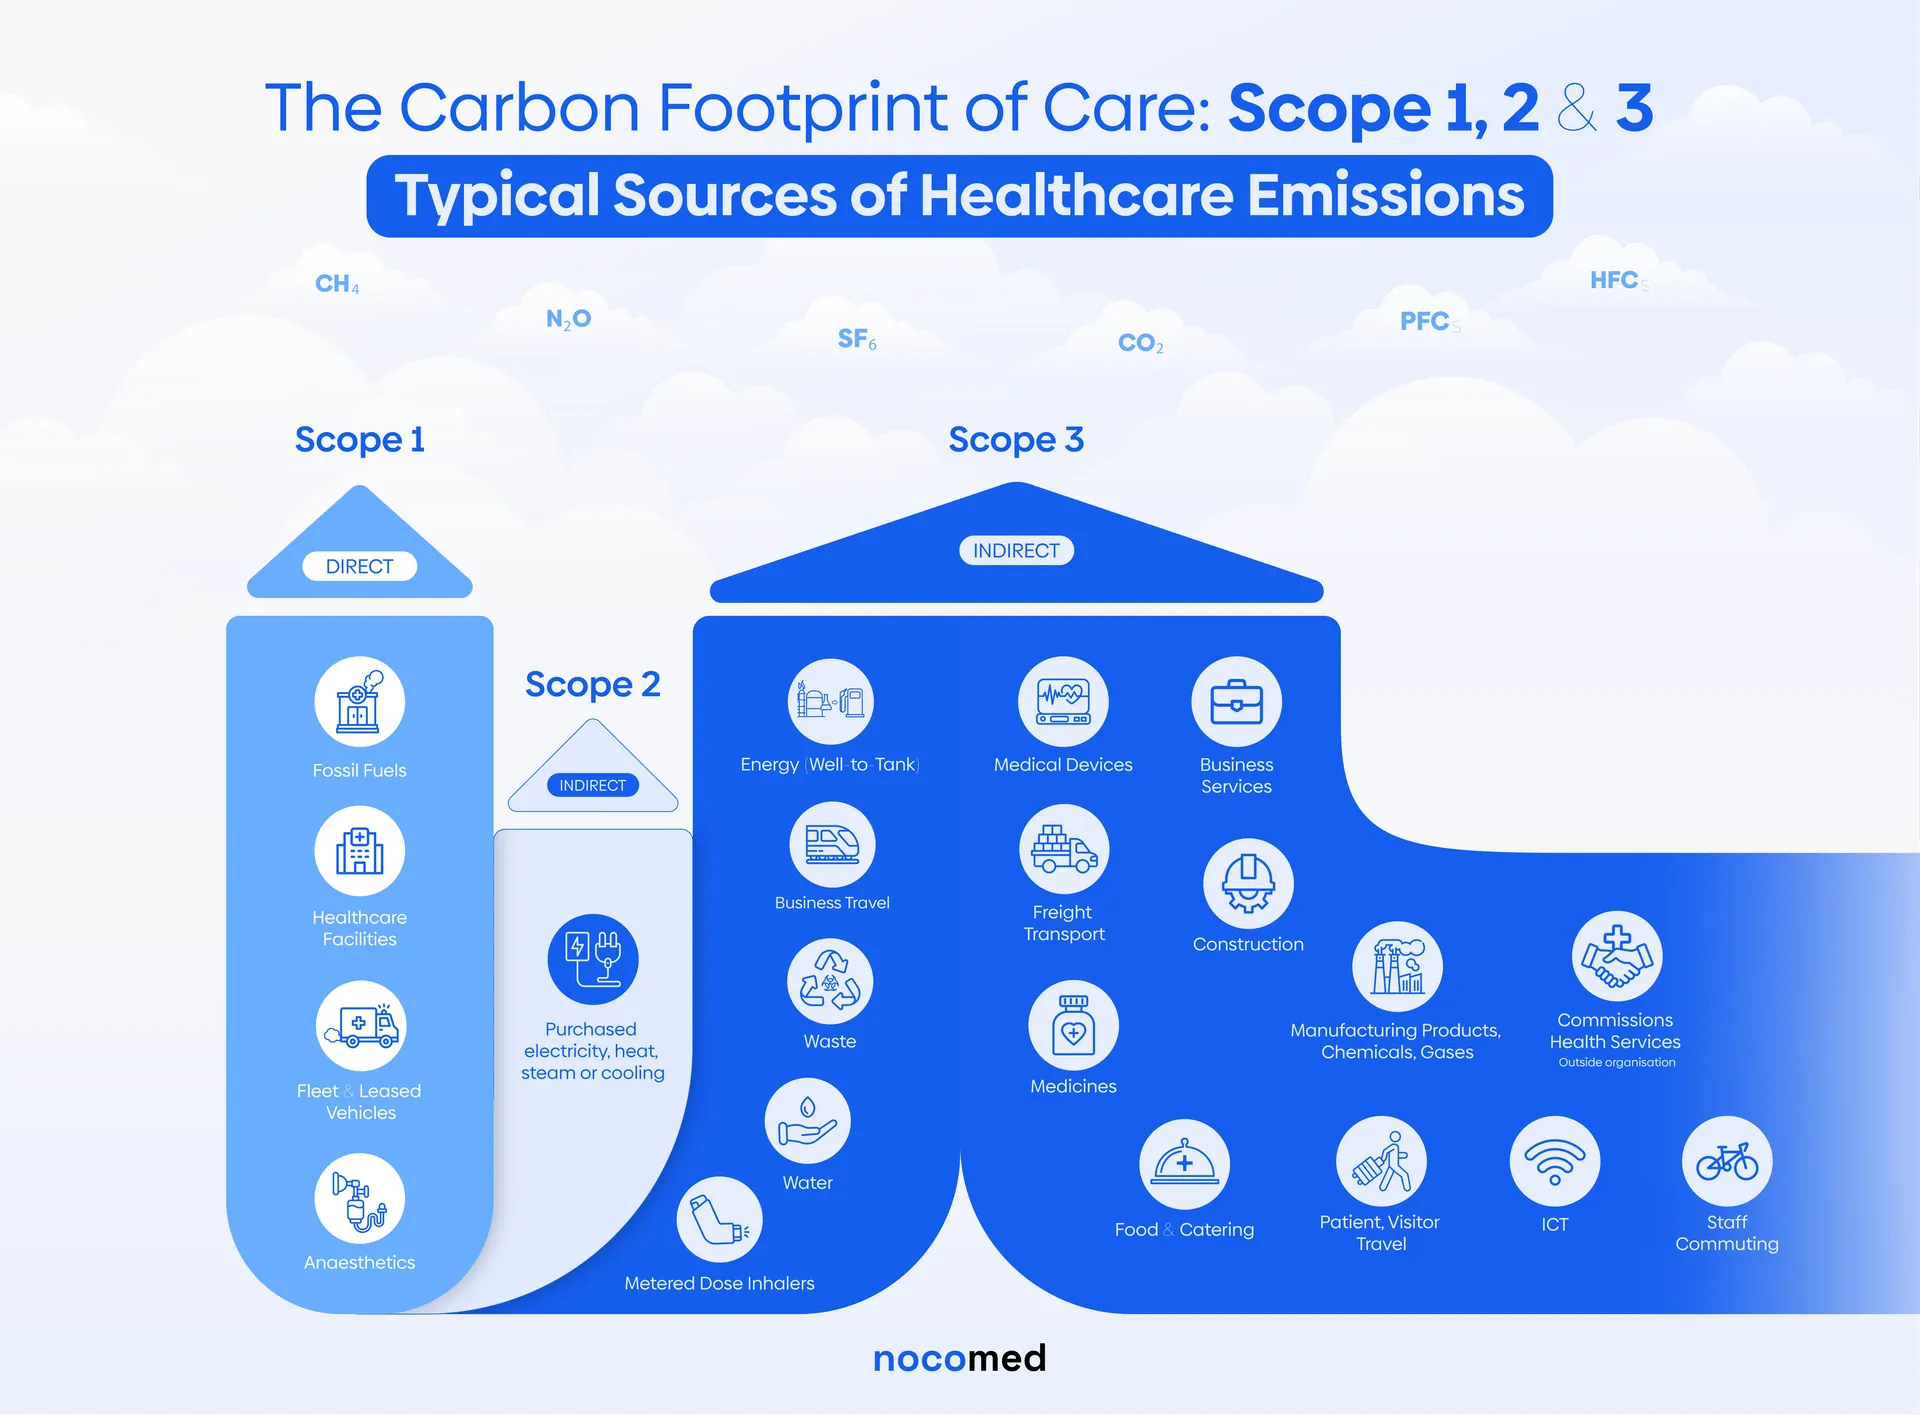
Nocomed is an Irish healthtech startup helping life sciences and healthcare companies measure and reduce their carbon footprint. Their platform handles complex technical data - Scope 1, 2 and 3 emissions - that needed to become clear visual content for their website and LinkedIn strategy. The challenge: making healthcare's carbon footprint understandable without oversimplifying the technical detail.
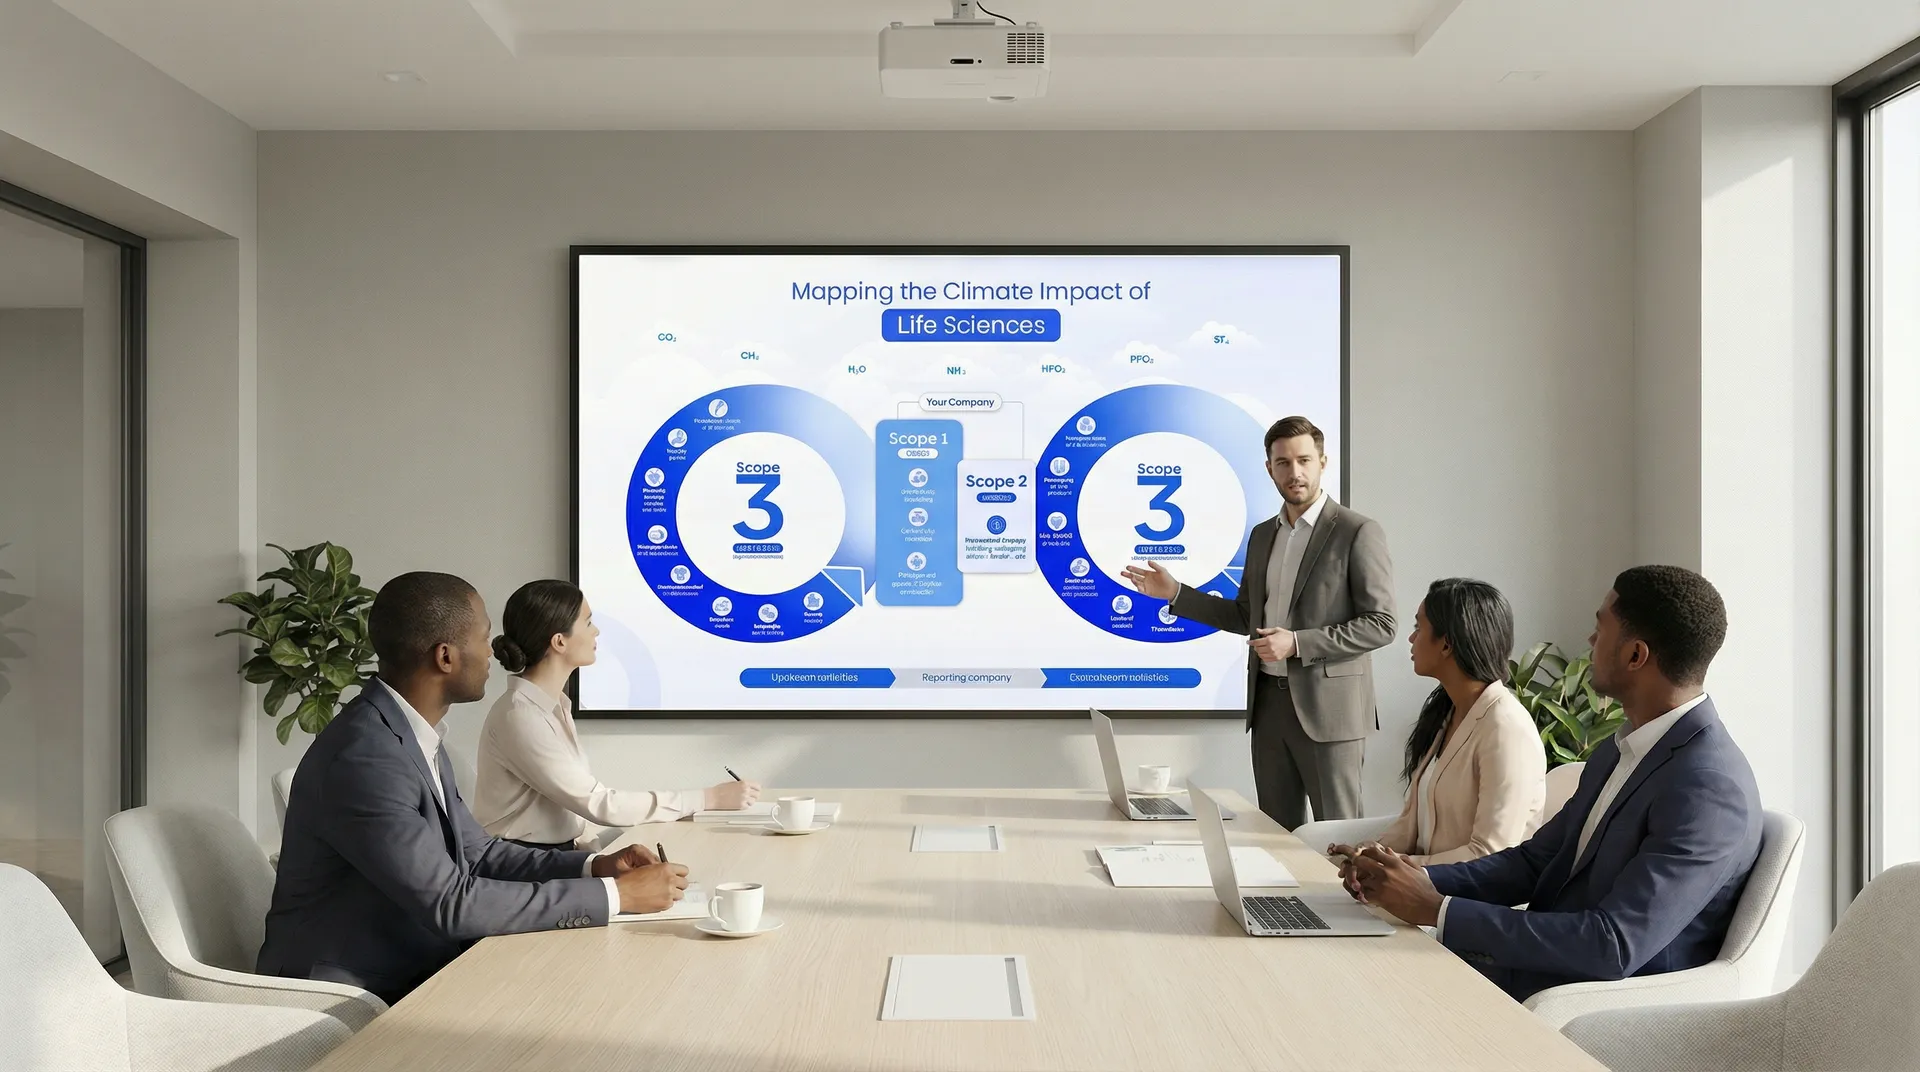
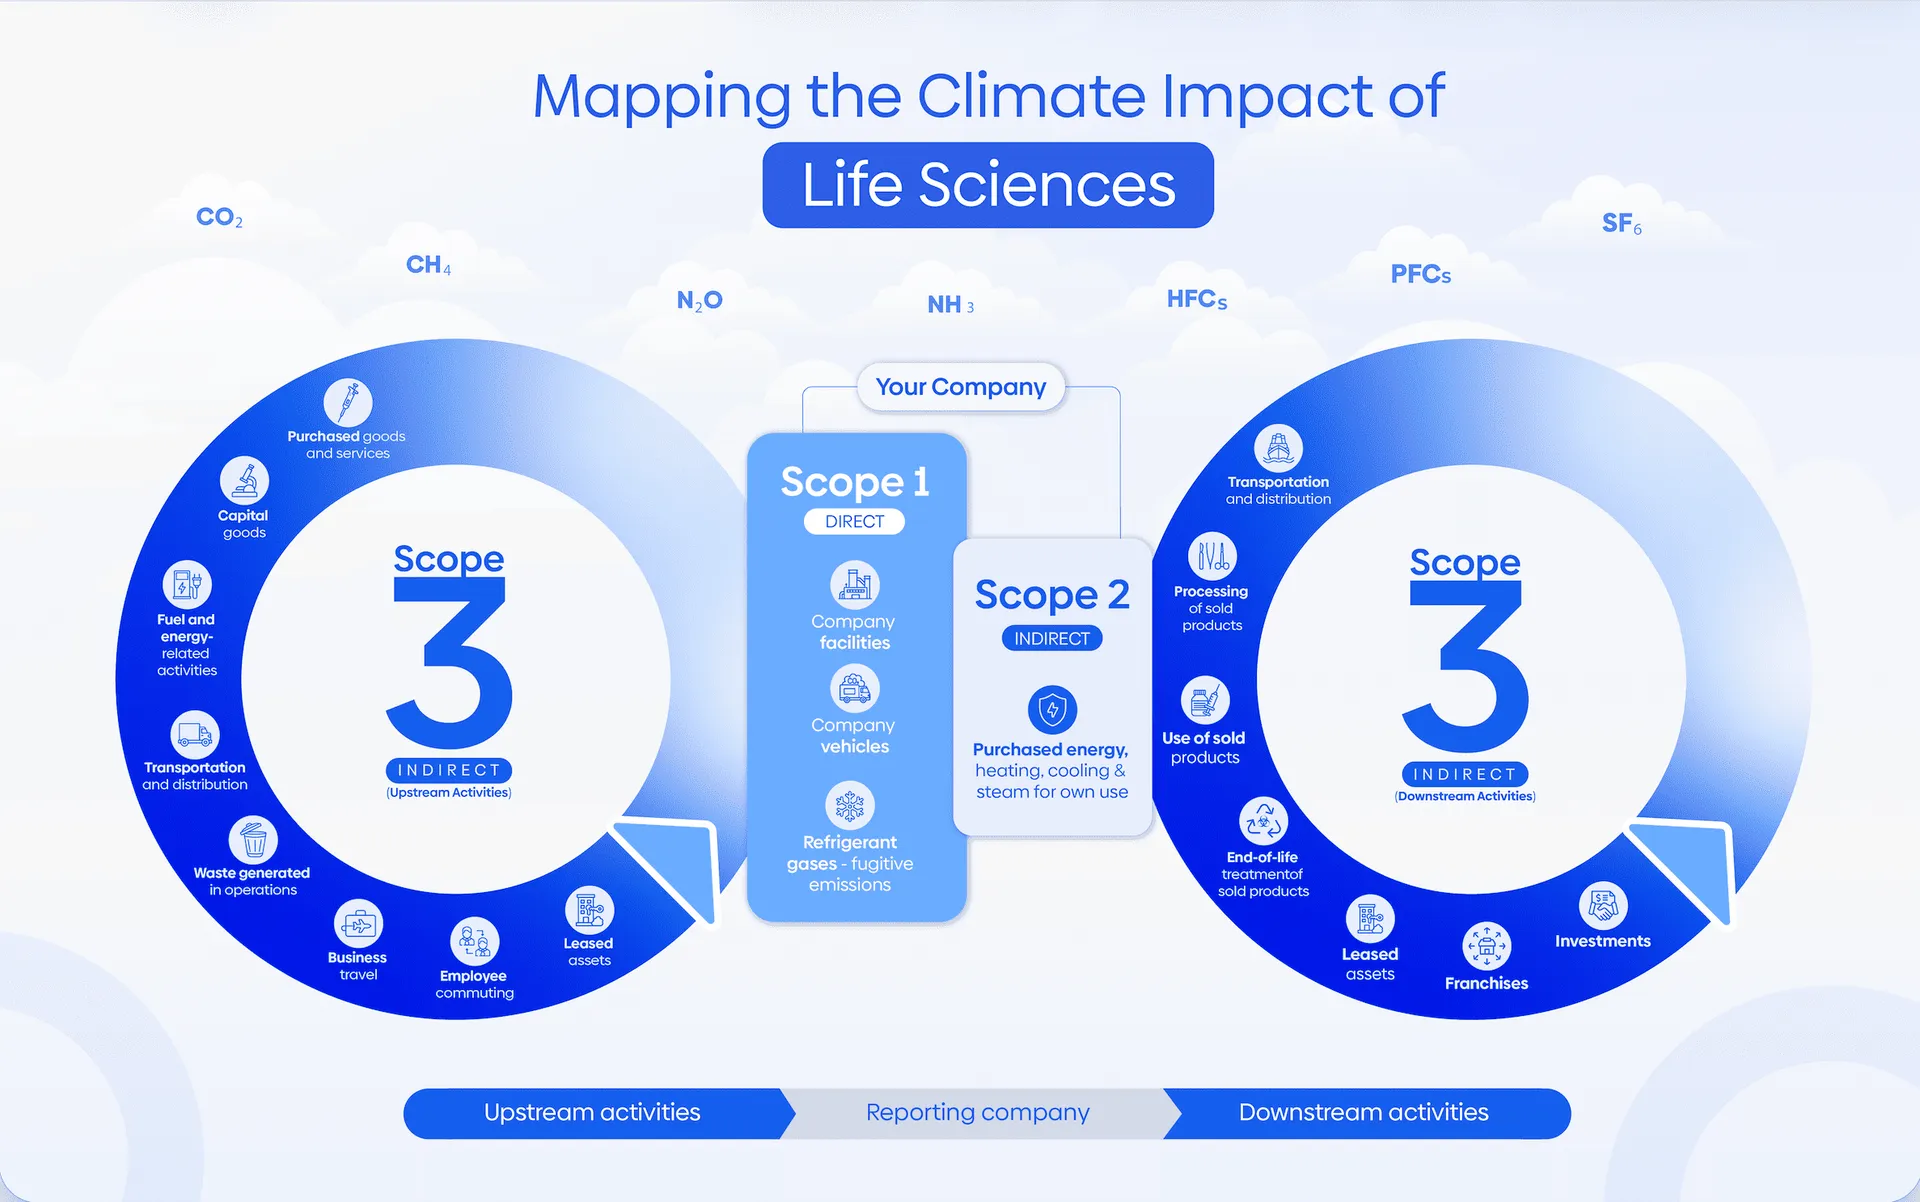
Infographics that visually map direct and indirect emissions across the healthcare and life sciences sector, with clear iconography and visual hierarchy guiding the reader through each scope. Plus LinkedIn-ready visuals that position Nocomed as a sustainability voice in healthcare. Complex technology turned into design that works - exactly what a tech startup needs to educate its market and build trust.

Let's make your brand
match your ambition.
Tell me about your company. I'll respond within 48 hours with ideas on how design can help you look as strong as your product actually is.